
Global performance highlights
Chapter 1.1
Global economic performance

At a
glance
Long description
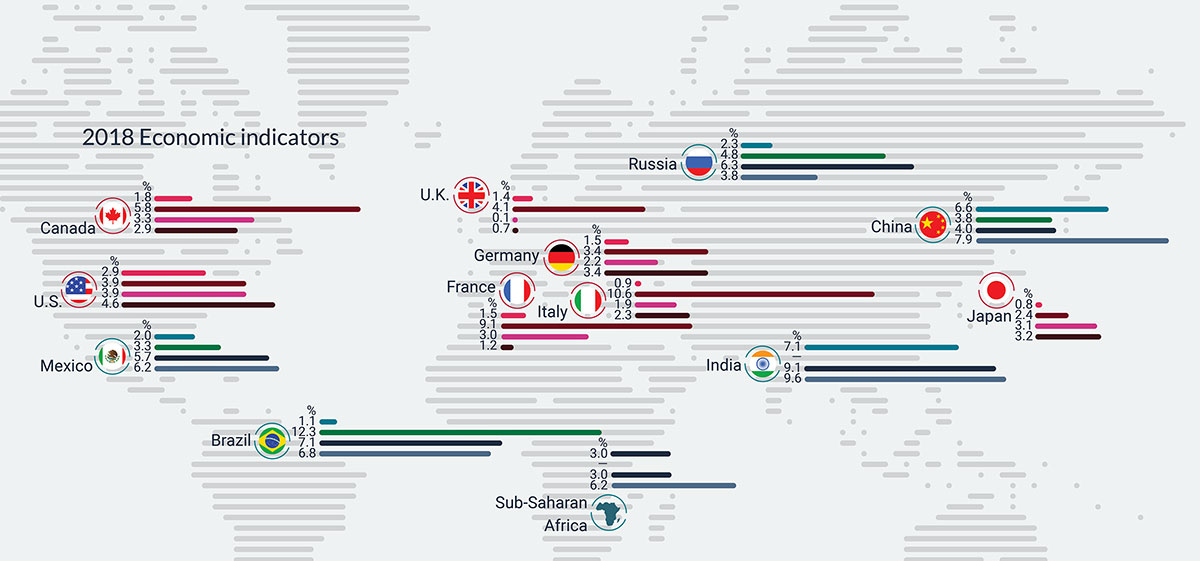
2018 economic indicators for selected regions and economies
| GDP Growth (%) | Unemployment (%) | Real Exports Growth* (%) | Real Imports Growth* (%) | |
|---|---|---|---|---|
| Advanced Economies | ||||
| Canada | 1.8 | 5.8 | 3.3 | 2.9 |
| Japan | 0.8 | 2.4 | 3.1 | 3.2 |
| United Kingdom | 1.4 | 4.1 | 0.1 | 0.7 |
| United States | 2.9 | 3.9 | 3.9 | 4.6 |
| France | 1.5 | 9.1 | 3.0 | 1.2 |
| Germany | 1.5 | 3.4 | 2.2 | 3.4 |
| Italy | 0.9 | 10.6 | 1.9 | 2.3 |
| Emerging Markets and Developing Economies | ||||
| Brazil | 1.1 | 12.3 | 7.1 | 6.8 |
| Mexico | 2.0 | 3.3 | 5.7 | 6.2 |
| China | 6.6 | 3.8 | 4.0 | 7.9 |
| India | 7.1 | 9.1 | 9.6 | |
| Russia | 2.3 | 4.8 | 6.3 | 3.8 |
| Sub-Saharan Africa | 3.0 | 3.0 | 6.2 |
Long description
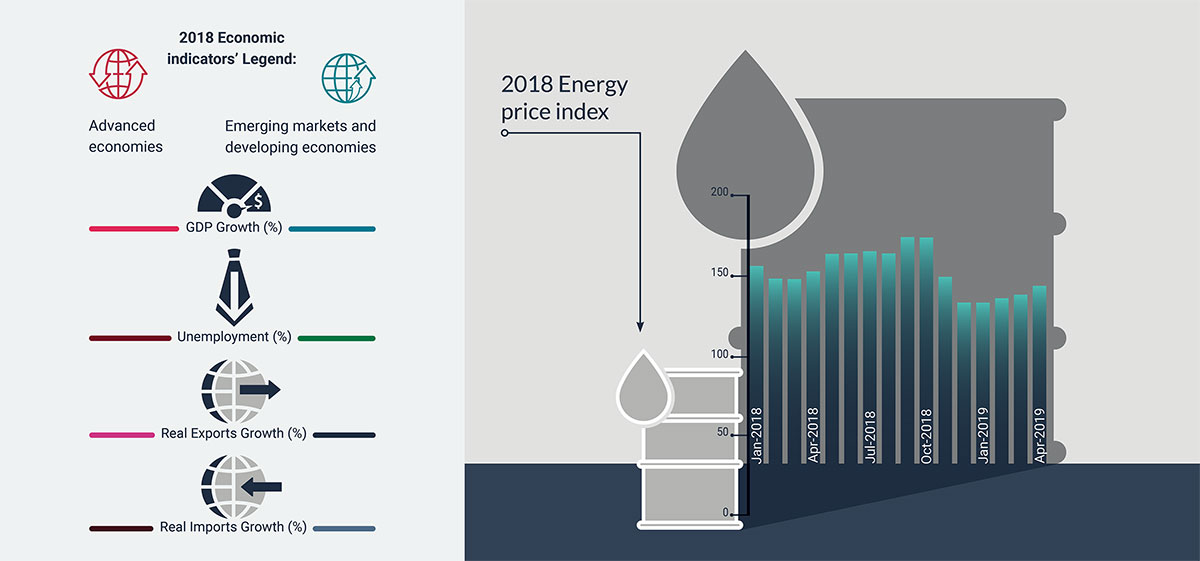
| 2018 Energy Price Index | |
|---|---|
| January, 2018 | 156.1 |
| February, 2018 | 148.2 |
| March, 2018 | 148.0 |
| April, 2018 | 152.7 |
| May, 2018 | 163.6 |
| June, 2018 | 163.9 |
| July, 2018 | 165.3 |
| August, 2018 | 163.9 |
| September, 2018 | 174.1 |
| October, 2018 | 173.8 |
| November, 2018 | 149.3 |
| December, 2018 | 133.3 |
| January, 2019 | 133.3 |
| February, 2019 | 136.0 |
| March, 2019 | 138.3 |
| April, 2019 | 143.8 |
Global overview
After a broad-based upswing in growth that lasted nearly two years, the global economy started to decelerate in the second half of 2018, causing global growth in 2018 (3.6%) to be slightly lower than that for 2017 (3.8%). The deceleration in 2018 was fairly evenly spread between advanced economies and emerging economies.
Rising trade tensions, lower business confidence, tightening of financial conditions, higher policy uncertainty across many economies and waning cyclical forces were some of the factors behind the slowdown in global activities.
Source: International Monetary Fund, World Economic Outlook, April 2019; retrieved on 20-06-2019
Long description
| 2014 | 2015 | 2016 | 2017 | 2018 | 2019 | 2020 | |
|---|---|---|---|---|---|---|---|
| World | 3.6 | 3.4 | 3.4 | 3.8 | 3.6 | 3.4 | 3.6 |
| Advanced economies | 2.1 | 2.3 | 1.7 | 2.4 | 2.2 | 1.8 | 1.7 |
| Emerging markets and developing economies | 4.7 | 4.3 | 4.6 | 4.8 | 4.5 | 4.4 | 4.8 |
Selected regions and countries overview
Growth among major advanced economies slowed in 2018, with the exception of the United States. Weakening consumer and business sentiment throughout 2018, along with other country-specific issues, caused 2018 gross domestic product (GDP) growth in the Euro area to decline to 1.8% from 2.4% in 2017. Germany grew 1.5% in 2018, compared to 2.5% in 2017, as subdued foreign demand from major trading partners and delays related to new fuel emission standards for diesel vehicles weighed on economic activity. In Italy, an elevated sovereign spreadFootnote 3 continued to put downward pressure on the economy, and growth declined to 0.9% in 2018 from 1.6% in 2017.
In France, street protests against rising fuel prices and high costs of living disrupted retail sales and consumption growth, and France’s economic growth slipped to 1.5% in 2018 from 2.2% in 2017. Uncertainty surrounding Brexit negotiations weighed on the United Kingdom, and growth weakened to 1.4% in 2018, down from 1.8% a year earlier. In Japan, economic growth declined to 0.8% in 2018 from 1.9% in 2017. Notably, however, the United States bucked the trend of decelerating growth, advancing 2.9% last year compared to 2.2% a year earlier. A tight labour market, strong consumption growth, and fiscal stimulus from tax reforms supported the acceleration in economic growth.
| GDP Growth (%) | Unemployment (%) | Real Exports Growth* (%) | Real Imports Growth* (%) | |
|---|---|---|---|---|
| Advanced economies | 2.2 | 5.1 | 3.1 | 3.3 |
| Canada | 1.8 | 5.8 | 3.3 | 2.9 |
| Japan | 0.8 | 2.4 | 3.1 | 3.2 |
| United Kingdom | 1.4 | 4.1 | 0.1 | 0.7 |
| United States | 2.9 | 3.9 | 3.9 | 4.6 |
| Euro area | 1.8 | 8.2 | 3.1 | 3.0 |
| France | 1.5 | 9.1 | 3.0 | 1.2 |
| Germany | 1.5 | 3.4 | 2.2 | 3.4 |
| Italy | 0.9 | 10.6 | 1.9 | 2.3 |
| Emerging markets and developing economies | 4.5 | 4.3 | 5.6 | |
| Commonwealth of Independent States | 2.8 | 5.6 | 3.9 | |
| Russia | 2.3 | 4.8 | 6.3 | 3.8 |
| Emerging and developing Asia | 6.4 | 5.5 | 8.5 | |
| China | 6.6 | 3.8 | 4.0 | 7.9 |
| India | 7.1 | 9.1 | 9.6 | |
| ASEAN-5 | 5.2 | 7.3 | 9.7 | |
| Emerging and developing Europe | 3.6 | 6.5 | 2.6 | |
| Latin America and the Caribbean | 1.0 | 3.0 | 4.3 | |
| Brazil | 1.1 | 12.3 | 7.1 | 6.8 |
| Mexico | 2.0 | 3.3 | 5.7 | 6.2 |
| Middle East and North Africa | 1.4 | -1.0 | -0.6 | |
| Sub-Saharan Africa | 3.0 | 3.0 | 6.2 | |
| Nigeria | 1.9 | 22.6 | -0.7 | 17.7 |
| South Africa | 0.8 | 27.1 | 1.4 | 2.5 |
Source: International Monetary Fund, World Economic Outlook, April 2019; retrieved on 20-06-2019
*Volume of exports and imports of goods and services
Growth in emerging markets and developing economies also slowed slightly in 2018, dropping to 4.5% from 4.8% in 2017. In China, economic growth slowed to 6.6% in 2018 from 6.8% the previous year. The slowdown was due to regulatory tightening, which led to slower growth in fixed asset investment, as the government attempted to put economic growth on a more sustainable path. Declines in automobile sales, along with U.S. tariff actions also weighed on the Chinese economy in 2018. India experienced a slight slowdown in economic growth in 2018 (7.1%) relative to 2017 (7.2%). Mexico, Canada’s third-largest merchandise trade partner, saw a slight decline in economic growth in 2018, at 2.0%, from 2.1% in 2017. By the end of 2018, Mexico’s sovereign spreadFootnote 4 rose as economic sentiment weakened due to policy uncertainty from the new administration that cancelled a planned airport, in addition to the lack of clarity with regard to energy and education reforms.
According to the International Monetary Fund (IMF) in April 2019, the momentum of slower growth globally in the second half of 2018 is expected to carry over into the first half of 2019, with a pickup in economic activity afterward. The IMF expects economic growth to slow to 3.3% in 2019, from 3.6% in 2018, before returning to 3.6% in 2020. The outlook reflects waning cyclical forces, a return to weak potential growth from advanced economies, and an uncertain recovery in emerging markets. Risks to the forecast tilt toward the downside as trade tensions between United States and various trading partners, uncertainty surrounding Brexit negotiations, stress on Italian banks, and other geo-political issues weigh heavily on the economic outlook. On the other hand, with growing evidence of slowing activity, many central banks have signalled a less aggressive path of monetary policy tightening.
United States overview
In 2018, while economic growth slowed in many advanced economies, it accelerated in the United States over the previous year. The U.S. expansion was broad-based, as personal consumption, investment, and exports all contributed to growth.
However, beginning in the second half of 2018, there were signs of softening investment brought about by increased uncertainty surrounding rising trade tensions with China.
Source: U.S. Bureau of Economic Analysis, May 30, 2019; retrieved on 20-06-2019
Long description
| 2016 | 2017 | 2018 | _ | T1 2018 | T2 2018 | T3 2018 | T4 2018 | T1 2019 | |
|---|---|---|---|---|---|---|---|---|---|
| Exports (Percentage Point) | -0.01 | 0.36 | 0.47 | 0.43 | 1.12 | -0.62 | 0.22 | 0.58 | |
| Business Fixed Investment (Percentage Point) | 0.29 | 0.81 | 0.9 | 1.34 | 1.10 | 0.21 | 0.54 | 0.18 | |
| Personal Consumption (Percentage Point) | 1.85 | 1.73 | 1.8 | 0.36 | 2.57 | 2.37 | 1.66 | 0.90 | |
| Government (Percentage Point) | 0.25 | -0.01 | 0.26 | 0.27 | 0.43 | 0.44 | -0.07 | 0.42 | |
| Inventories (Percentage Point) | -0.53 | 0 | 0.12 | 0.27 | -1.17 | 2.33 | 0.11 | 0.6 | |
| Imports (Percentage Point) | -0.28 | -0.67 | -0.68 | -0.45 | 0.1 | -1.37 | -0.3 | 0.39 | |
| GDP Growth (%) | 1.6 | 2.2 | 2.9 | 2.2 | 4.2 | 3.4 | 2.2 | 3.1 |
Consumption in the United States continued to be supported by a tight labour market (3.9% unemployment rate in 2018) and a slight pickup in wage growth (3.0% in 2018). According to the IMF forecast released in April 2019, U.S. economic growth is expected to decelerate to 2.3% in 2019 and 1.9% in 2020. The decline in growth reflects the negative impact of trade and political uncertainties, global cyclical forces and the waning positive impacts of fiscal stimulus.
Furthermore, there are risks to U.S. economic growth, which include further escalation of trade tensions with China and the slow ratification process for the new Canada-United States-U.S.-Mexico Agreement (CUSMA). The U.S. economic outlook from the Organisation for Economic Co-operation and Development (OECD, May 2019) is slightly more positive, 2.8% in 2019 and 2.3% in 2020. The OECD believes that a strong labour market and increasing wages will support consumption growth.
Source: U.S. Bureau of Labor Statistics and IMF, World Economic Outlook, April 2018; retrieved on 20-06-2019
Long description
| 2011 | 2012 | 2013 | 2014 | 2015 | 2016 | 2017 | 2018 | |
|---|---|---|---|---|---|---|---|---|
| Employment Growth (in thousands) | 1570 | 2243 | 2206 | 2577 | 2885 | 2509 | 2272 | 2450 |
| Unemployment Rate (in %) | 8.93 | 8.08 | 7.36 | 6.16 | 5.28 | 4.88 | 4.35 | 3.89 |
| Average Hourly Wage Growth (in %) | 2.08 | 2.00 | 2.00 | 2.13 | 2.25 | 2.48 | 2.69 | 2.96 |
Global commodity prices
Global energy prices started to decline in the latter part of 2018; the IMF energy price index dropped 23% between September and December 2018. Slowing global growth, supply factors such as the temporary waiver of U.S. sanctions on Iranian oil exports to certain countries, and record high U.S. crude oil production were the main reasons for the decline.
The average monthly West Texas Intermediate crude oil price was US$70.75 per barrel in October 2018, but plunged to US$49.52 per barrel in December 2018. In recent months, crude oil prices have picked up slightly (to US$60.83 per barrel in May 2019), but still remain below their October 2018 level. Excluding energy, overall commodity prices have remained relatively stable.
Source: IMF Primary Commodity Price System and U.S. Energy Information Administration; retrieved on 20-06-2019
Long description
| Mai 2014 | Juin 2014 | Juillet 2014 | Aug 2014 | Sept. 2014 | Oct. 2014 | Nov. 2014 | Déc. 2014 | Janv. 2015 | Feb 2015 | Mars 2015 | Apr 2015 | Mai 2015 | Jun 2015 | Juillet 2015 | Aug 2015 | Sept. 2015 | Oct 2015 | Nov. 2015 | Dec 2015 | Janv. 2016 | Feb 2016 | Mars 2016 | Apr 2016 | Mai 2016 | Jun 2016 | Juillet 2016 | Aug 2016 | Sept. 2016 | Oct 2016 | Nov. 2016 | Dec 2016 | Janv. 2017 | Feb 2017 | Mars 2017 | Apr 2017 | Mai 2017 | Jun 2017 | Juillet 2017 | Aug 2017 | Sept. 2017 | Oct 2017 | Nov. 2017 | Dec 2017 | Janv. 2018 | Feb 2018 | Mars 2018 | Apr 2018 | Mai 2018 | Jun 2018 | Juillet 2018 | Aug 2018 | Sept. 2018 | Oct 2018 | Nov. 2018 | Dec 2018 | Janv. 2019 | Feb 2019 | Mars 2019 | Apr-2019 | |
|---|---|---|---|---|---|---|---|---|---|---|---|---|---|---|---|---|---|---|---|---|---|---|---|---|---|---|---|---|---|---|---|---|---|---|---|---|---|---|---|---|---|---|---|---|---|---|---|---|---|---|---|---|---|---|---|---|---|---|---|---|
| Energy (2016 is set as baseline at 100) | 231.32 | 235.19 | 226.54 | 218.06 | 210.91 | 193.02 | 178.46 | 148.55 | 122.68 | 134.81 | 129.40 | 131.38 | 138.45 | 135.12 | 123.66 | 109.45 | 110.02 | 109.52 | 101.65 | 90.45 | 77.53 | 78.14 | 87.46 | 92.26 | 101.39 | 106.42 | 102.00 | 103.77 | 105.17 | 114.81 | 108.00 | 123.05 | 128.33 | 126.00 | 116.32 | 119.42 | 114.94 | 108.24 | 112.04 | 118.29 | 126.23 | 130.80 | 141.56 | 144.91 | 156.13 | 148.24 | 147.97 | 152.74 | 163.58 | 163.93 | 165.27 | 163.92 | 174.09 | 173.77 | 149.34 | 133.35 | 133.30 | 136.05 | 138.256 | 143.768 |
| Non-Fuel Commodities (in millions of barrels) | 126.3 | 124.3 | 124.7 | 121.3 | 117.2 | 114.9 | 112.9 | 111 | 109.3 | 106.6 | 103.6 | 104.4 | 106 | 104.7 | 101.4 | 99 | 97.7 | 97.1 | 92.4 | 90.8 | 90.8 | 93.8 | 97.9 | 99.7 | 100 | 100.9 | 103.4 | 102.9 | 102.1 | 101.1 | 103.8 | 103.6 | 107.4 | 110 | 107.3 | 105.4 | 104.7 | 103.9 | 106 | 106.4 | 106.5 | 105.9 | 106.5 | 107.1 | 111.6 | 112.3 | 111.8 | 111.8 | 112.4 | 110.3 | 106.4 | 103.6 | 104.1 | 106 | 103.4 | 104.3 | 106.3 | 107.8 | 107.8 | 109.8 |
| U.S. Crude Oil Production (in millions of barrels) | 267 | 261.5 | 272.3 | 275.5 | 271.2 | 285.8 | 279.1 | 293.5 | 290.9 | 266.3 | 296.9 | 289.5 | 293.4 | 280.3 | 292.3 | 291.4 | 283.8 | 291 | 279.5 | 286.8 | 285.1 | 262.6 | 281.5 | 266 | 273.5 | 260.1 | 267.7 | 268.8 | 255.6 | 272.4 | 266.6 | 272.1 | 274 | 254.3 | 283.3 | 272.5 | 284.2 | 272.2 | 286.1 | 286.6 | 284.9 | 300.8 | 303.1 | 311.3 | 309.8 | 287 | 324.3 | 314.3 | 324.4 | 320.2 | 339 | 351.1 | 344.1 | 358.3 | 357.8 | 370.9 | 367.7 | 326.6 | 369 | 0 |

Chapter 1.2
Global trade performance

At a
glance
Long description
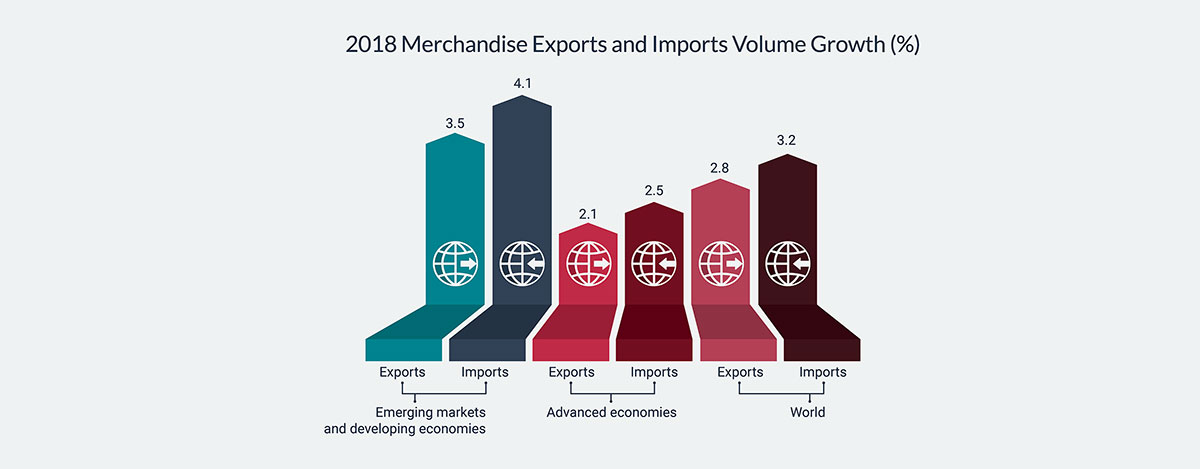
| Exports Volume Growth (%) | Imports Volume Growth (%) | |
|---|---|---|
| World | 2.8 | 3.2 |
| Advanced economies | 2.1 | 2.5 |
| Emerging markets and developing economies | 3.5 | 4.1 |
Long description
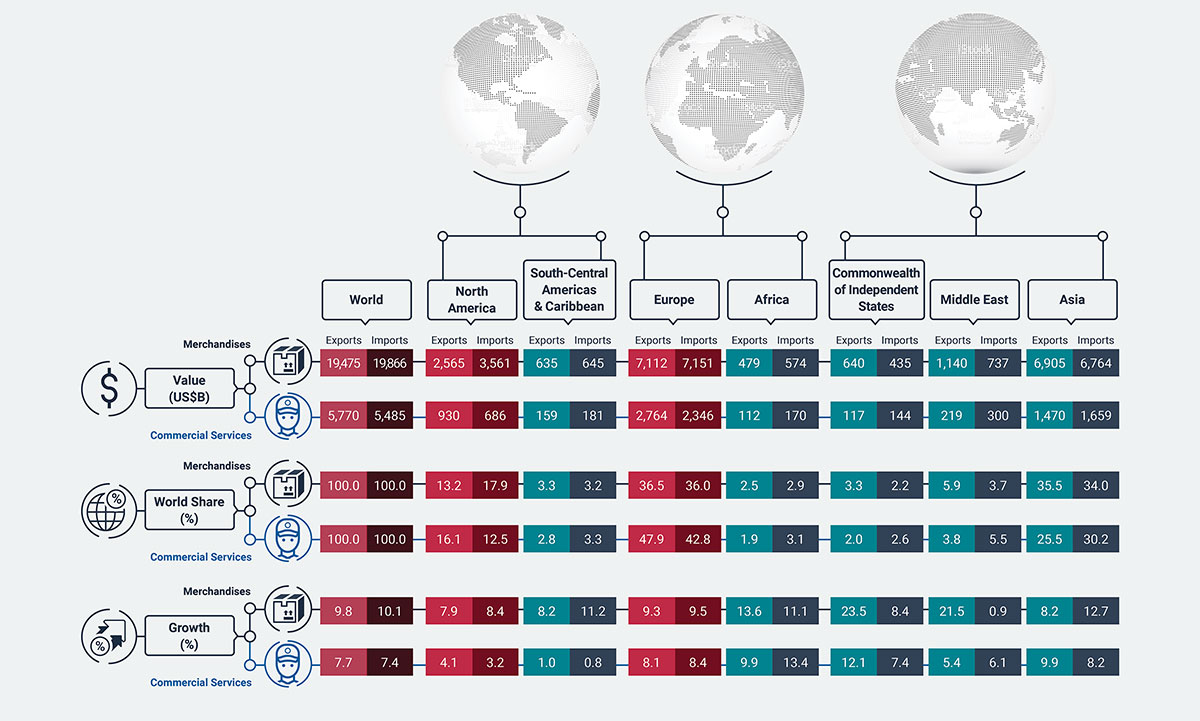
| Value (US$B) | World share (%) | Growth (%) | |
|---|---|---|---|
| World | 19,475 | 100 | 9.8 |
| North America | 2,565 | 13.2 | 7.9 |
| South and Central America and the Caribbean | 635 | 3.3 | 8.2 |
| Europe | 7,112 | 36.5 | 9.3 |
| Africa | 479 | 2.5 | 13.6 |
| Commonwealth of Independent States | 640 | 3.3 | 23.5 |
| Middle East | 1,140 | 5.9 | 21.5 |
| Asia | 6,905 | 35.5 | 8.2 |
2018 Merchandise Imports
| Value (US$B) | World share (%) | Growth (%) | |
|---|---|---|---|
| World | 19,866 | 100.0 | 10.1 |
| North America | 3,561 | 17.9 | 8.4 |
| South and Central America and the Caribbean | 645 | 3.2 | 11.2 |
| Europe | 7,151 | 36.0 | 9.5 |
| Africa | 574 | 2.9 | 11.1 |
| Commonwealth of Independent States | 435 | 2.2 | 8.4 |
| Middle East | 737 | 3.7 | 0.9 |
| Asia | 6,764 | 34.0 | 12.7 |
2018 Commercial Services Exports
| Value (US$B) | World share (%) | Growth (%) | |
|---|---|---|---|
| World | 5,770 | 100.0 | 7.7 |
| North America | 930 | 16.1 | 4.1 |
| South and Central America and the Caribbean | 159 | 2.8 | 1.0 |
| Europe | 2,764 | 47.9 | 8.1 |
| Africa | 112 | 1.9 | 9.9 |
| Commonwealth of Independent States | 117 | 2.0 | 12.1 |
| Middle East | 219 | 3.8 | 5.4 |
| Asia | 1,470 | 25.5 | 9.9 |
2018 Commercial Services Imports
| Value (US$B) | World share (%) | Growth (%) | |
|---|---|---|---|
| World | 5,485 | 100.0 | 7.4 |
| North America | 686 | 12.5 | 3.2 |
| South and Central America and the Caribbean | 181 | 3.3 | 0.8 |
| Europe | 2,346 | 42.8 | 8.4 |
| Africa | 170 | 3.1 | 13.4 |
| Commonwealth of Independent States | 144 | 2.6 | 7.4 |
| Middle East | 300 | 5.5 | 6.1 |
| Asia | 1,659 | 30.2 | 8.2 |
International trade
overview
As global economic growth lost momentum in 2018, growth in the volume of world merchandise exports also slowed in both developed economies and emerging markets.
Since the 2009 recession, export volume growth in developing and emerging economies has been outpacing growth in developed economies, with the exception of 2015.
Source: WTO Database; retrieved on 21-06-2019
Long description
| 2014 | 2015 | 2016 | 2017 | 2018 | |
|---|---|---|---|---|---|
| Developing and Emerging Economies | 2.7 | 1.7 | 2.3 | 5.6 | 3.5 |
| Developed Economies | 2.1 | 2.4 | 1 | 3.6 | 2.1 |
| World | 2.4 | 2.1 | 1.6 | 4.5 | 2.8 |
Similar to exports, the growth in the volume of imports also slowed in 2018 across both developed economies and emerging markets.
Merchandise import volumes grew faster in developed economies from 2014 to 2016, but the trend reversed beginning in 2017.
Source: WTO Database; retrieved on 21-06-2019
Long description
| 2014 | 2015 | 2016 | 2017 | 2018 | |
|---|---|---|---|---|---|
| Developing and Emerging Economies | 2.60 | 0.60 | 1.30 | 6.80 | 4.10 |
| Developed Economies | 3.30 | 4.20 | 2.00 | 3.30 | 2.50 |
| World | 3.00 | 2.60 | 1.70 | 4.70 | 3.20 |
World merchandise
trade overview
World merchandise exportsFootnote 5 grew 9.8% in 2018 to reach over US$19 trillion. Regionally, exports from the Commonwealth of Independent States grew the fastest at 24%, followed by the Middle East at 21%. North America had the lowest rate of merchandise export growth in 2018, at 7.9%. Among the major North American economies, Mexico had the highest rate of merchandise export growth, and Canada the lowest.
As a result, Mexican exports surpassed those of Canada, causing the two countries to switch rank (12th to 13th for Canada and 13th to 12th for Mexico) among the largest merchandise exporters to the world. The other change in ranking among top merchandise exporters was France overtaking Hong Kong SARFootnote 6 and moving into 7th place.

| 2018 Merchandise Exports Value (US$B) |
2018 Merchandise Exports Share (%) |
2018 Merchandise Exports Growth (%) |
2018 Merchandise Exports Rank |
Rank 2017 | |
|---|---|---|---|---|---|
| World | 19,475 | 100.0 | 9.8 | ||
| North America | 2,565 | 13.2 | 7.9 | ||
| Canada | 450 | 2.3 | 6.9 | 13 | 12 |
| United States | 1,664 | 8.5 | 7.6 | 2 | 2 |
| Mexico | 451 | 2.3 | 10.1 | 12 | 13 |
| Europe | 7,112 | 36.5 | 9.3 | ||
| United Kingdom | 486 | 2.5 | 10.1 | 10 | 10 |
| European Union (27) | 6,448 | 33.1 | 9.4 | ||
| Euro area (19) | 4,986 | 25.6 | 9.2 | ||
| Belgium | 467 | 2.4 | 8.4 | 11 | 11 |
| France | 582 | 3.0 | 8.7 | 7 | 8 |
| Germany | 1,561 | 8.0 | 7.8 | 3 | 3 |
| Italy | 547 | 2.8 | 7.7 | 9 | 9 |
| Netherlands | 723 | 3.7 | 10.8 | 5 | 5 |
| Commonwealth of Independent States | 640 | 3.3 | 23.5 | ||
| Russia | 444 | 2.3 | 25.6 | 14 | 15 |
| Middle East | 1,140 | 5.9 | 21.5 | ||
| Asia | 6,905 | 35.5 | 8.2 | ||
| China | 2,487 | 12.8 | 9.9 | 1 | 1 |
| Hong Kong SAR | 569 | 2.9 | 3.4 | 8 | 7 |
| India | 326 | 1.7 | 8.8 | 19 | 20 |
| Japan | 738 | 3.8 | 5.8 | 4 | 4 |
| Korea, Republic of | 605 | 3.1 | 5.4 | 6 | 6 |
| South and Central America and the Caribbean | 635 | 3.3 | 8.2 | ||
| Brazil | 240 | 1.2 | 10.0 | 27 | 25 |
| Africa | 479 | 2.5 | 13.6 | ||
| Nigeria | 61 | 0.3 | 36.4 | 50 | 52 |
| South Africa | 94 | 0.5 | 5.9 | 39 | 38 |
Source: WTO Database; retrieved on 21-06-2019
World merchandise imports grew 10%Footnote 7 in 2018 to reach US$20 trillion, with Asia leading growth at 13%, followed by South and Central America and the Caribbean (11%) and Africa (11%). Merchandise imports in North America grew by 8.4%, with Mexico growing the fastest (10%) among the major economies, and Canada the slowest (6.1%).
As a result, Canada and Mexico switched places in the ranking of global merchandise importers. Other movements among the top merchandise importers include the Netherlands overtaking Hong Kong SAR in 7th place, and India overtaking Italy in 10th place.

| 2018 Merchandise Imports Value (US$B) |
2018 Merchandise Imports Share (%) |
2018 Merchandise Imports Growth (%) |
2018 Merchandise Imports Rank |
Rank 2017 | |
|---|---|---|---|---|---|
| World | 19,866 | 100.0 | 10.1 | ||
| North America | 3,561 | 17.9 | 8.4 | ||
| Canada | 469 | 2.4 | 6.1 | 13 | 12 |
| United States | 2,614 | 13.2 | 8.5 | 1 | 1 |
| Mexico | 477 | 2.4 | 10.3 | 12 | 13 |
| Europe | 7,151 | 36.0 | 9.5 | ||
| United Kingdom | 674 | 3.4 | 4.7 | 5 | 5 |
| European Union (27) | 6,466 | 32.5 | 10.4 | ||
| Euro area (19) | 4,727 | 23.8 | 10.9 | ||
| Belgium | 450 | 2.3 | 10.1 | 14 | 14 |
| France | 673 | 3.4 | 8.7 | 6 | 6 |
| Germany | 1,286 | 6.5 | 10.6 | 3 | 3 |
| Italy | 501 | 2.5 | 10.5 | 11 | 10 |
| Netherlands | 646 | 3.3 | 12.4 | 7 | 8 |
| Commonwealth of Independent States | 435 | 2.2 | 8.4 | ||
| Russia | 249 | 1.3 | 4.6 | 22 | 20 |
| Middle East | 737 | 3.7 | 0.9 | ||
| Asia | 6,764 | 34.0 | 12.7 | ||
| China | 2,136 | 10.8 | 15.8 | 2 | 2 |
| Hong Kong SAR | 628 | 3.2 | 6.4 | 8 | 7 |
| India | 511 | 2.6 | 13.9 | 10 | 11 |
| Japan | 749 | 3.8 | 11.4 | 4 | 4 |
| Korea, Republic of | 535 | 2.7 | 11.9 | 9 | 9 |
| South and Central America and the Caribbean | 645 | 3.2 | 11.2 | ||
| Brazil | 189 | 0.9 | 19.8 | 28 | 29 |
| Africa | 574 | 2.9 | 11.1 | ||
| Nigeria | 42 | 0.2 | 33.9 | 59 | 63 |
| South Africa | 114 | 0.6 | 12.4 | 35 | 35 |
Source: WTO Database; retrieved on 21-06-2019
Commercial services
trade overview
At 7.7%, world commercial services exports grew slightly slower than the 9.8% pace of world merchandise exports in 2018. By region, the Commonwealth of Independent States led growth in commercial services exports at 12%, followed by Asia and Africa at 9.9% each. North America was the second-slowest growing region (4.1%), expanding only faster than South and Central America and the Caribbean (1.0%). Canada’s commercial services exports grew 5.6% in 2018 and dropped one place to the 18th spot among the world’s top commercial services exporters.
Both India and Japan dropped a place in the rankings as Ireland leapfrogged over them into 7th place, due to high growth (14%). China and India, the two largest emerging economies, experienced strong commercial services exports growth in 2018, at 17% and 11%, respectively. Among developed economies, the Netherlands increased its commercial services exports by 11% to US$241 billion.

| 2018 Commercial Services Exports Value (US$B) |
2018 Commercial Services Exports Share (%) |
2018 Commercial Services Exports Growth (%) |
2018 Commercial Services Exports Rank |
2017 Rank | |
|---|---|---|---|---|---|
| World | 5,770 | 100.0 | 7.7 | ||
| North America | 930 | 16.1 | 4.1 | ||
| Canada | 92 | 1.6 | 5.6 | 18 | 17 |
| United States | 808 | 14.0 | 3.8 | 1 | 1 |
| Mexico | 28 | 0.5 | 5.1 | 40 | 38 |
| Europe | 2,764 | 47.9 | 8.1 | ||
| Belgium | 121 | 2.1 | 3.0 | 13 | 13 |
| France | 291 | 5.0 | 6.2 | 4 | 4 |
| Germany | 326 | 5.6 | 7.3 | 3 | 3 |
| Italy | 121 | 2.1 | 9.0 | 14 | 14 |
| Netherlands | 241 | 4.2 | 11.4 | 6 | 6 |
| United Kingdom | 373 | 6.5 | 5.6 | 2 | 2 |
| Commonwealth of Independent States | 117 | 2.0 | 12.1 | ||
| Russia | 64 | 1.1 | 12.3 | 26 | 26 |
| Middle East | 219 | 3.8 | 5.4 | ||
| Asia | 1,470 | 25.5 | 9.9 | ||
| China | 265 | 4.6 | 17.1 | 5 | 5 |
| Hong Kong SAR | 114 | 2.0 | 9.3 | 15 | 15 |
| India | 204 | 3.5 | 10.7 | 8 | 7 |
| Japan | 187 | 3.2 | 3.1 | 9 | 8 |
| Korea, Republic of | 95 | 1.7 | 10.4 | 17 | 18 |
| South and Central America and the Caribbean | 159 | 2.8 | 1.0 | ||
| Brazil | 33 | 0.6 | -1.3 | 36 | 36 |
| Africa | 112 | 1.9 | 9.9 | ||
| Nigeria | 4 | 0.1 | -4.3 | 85 | 81 |
| South Africa | 16 | 0.3 | 1.4 | 49 | 48 |
Source: WTO Database; retrieved on 21-06-2019
World commercial services imports grew 7.4% in 2018, with Africa leading the way at 13% and accounting for 3.1% of overall world commercial services imports. In North America, commercial services imports increased 3.2%, recording the second-slowest regional growth rate. The United States remained the top importer of commercial services, at US$536 billion.
Canada’s imports grew 4.6%, to remain in 14th place among the leading commercial services importers. The large and fast-growing emerging economies of China and India saw high growth in commercial services imports, at 12% and 14%, respectively. Notable among developed economies, the Netherlands (11%), the United Kingdom (11%) and Belgium (12%) all saw high levels of growth in their commercial services imports.

| 2018 Commercial Services Imports Value (US$B) |
2018 Commercial Services Imports Share (%) |
2018 Commercial Services Imports Growth (%) |
2018 Commercial Services Imports Rank |
2017 Rank | |
|---|---|---|---|---|---|
| World | 5,485 | 100.0 | 7.4 | ||
| North America | 686 | 12.5 | 3.2 | ||
| Canada | 112 | 2.0 | 4.6 | 14 | 14 |
| United States | 536 | 9.8 | 3.0 | 1 | 1 |
| Mexico | 37 | 0.7 | 0.7 | 32 | 32 |
| Europe | 2,346 | 42.8 | 8.4 | ||
| Belgium | 129 | 2.3 | 11.8 | 11 | 12 |
| France | 257 | 4.7 | 4.7 | 4 | 4 |
| Germany | 350 | 6.4 | 6.2 | 3 | 3 |
| Italy | 123 | 2.2 | 8.5 | 12 | 13 |
| Netherlands | 229 | 4.2 | 10.9 | 6 | 6 |
| United Kingdom | 230 | 4.2 | 10.9 | 5 | 5 |
| Commonwealth of Independent States | 144 | 2.6 | 7.4 | ||
| Russia | 93 | 1.7 | 6.8 | 16 | 16 |
| Middle East | 300 | 5.5 | 6.1 | ||
| Asia | 1,659 | 30.2 | 8.2 | ||
| China | 521 | 9.5 | 12.2 | 2 | 2 |
| Hong Kong SAR | 81 | 1.5 | 4.9 | 19 | 18 |
| India | 175 | 3.2 | 14.0 | 10 | 10 |
| Japan | 198 | 3.6 | 3.8 | 8 | 8 |
| Korea, Republic of | 123 | 2.2 | 2.1 | 13 | 11 |
| South and Central America and the Caribbean | 181 | 3.3 | 0.8 | ||
| Brazil | 66 | 1.2 | -0.9 | 24 | 23 |
| Africa | 170 | 3.1 | 13.4 | ||
| Nigeria | 31 | 0.6 | 70.1 | 37 | 43 |
| South Africa | 16 | 0.3 | 2.2 | 50 | 49 |
Source: WTO Database; retrieved on 21-06-2019
Chapter 1.3
Global investment performance

At a
glance
Long description
| Value (US$B) | Growth (%) | World share (%) | |
|---|---|---|---|
| World | 1,297 | -13 | 100 |
| Europe | 172 | -55 | 13 |
| North America | 291 | -4 | 23 |
| Africa | 46 | 11 | 4 |
| Latin America and the Caribbean | 147 | -6 | 11 |
| Developing Asia | 512 | 4 | 39 |
| Transition economies | 34 | -28 | 3 |
Long description
| Value (US$B) | Growth (%) | World share (%) | |
|---|---|---|---|
| United States | 252 | -9.2 | 19.4 |
| China | 139 | 3.7 | 10.7 |
| Hong Kong SAR | 116 | 4.5 | 8.9 |
| Singapore | 78 | 2.5 | 6.0 |
| Netherlands | 70 | 19.7 | 5.4 |
| United Kingdom | 64 | -36.3 | 5.0 |
| Brazil | 61 | -9.4 | 4.7 |
| Australia | 60 | 42.9 | 4.7 |
| Cayman Islands | 57 | 124.5 | 4.4 |
| British Virgin Islands | 44 | -23.2 | 3.4 |
Foreign direct investment overview
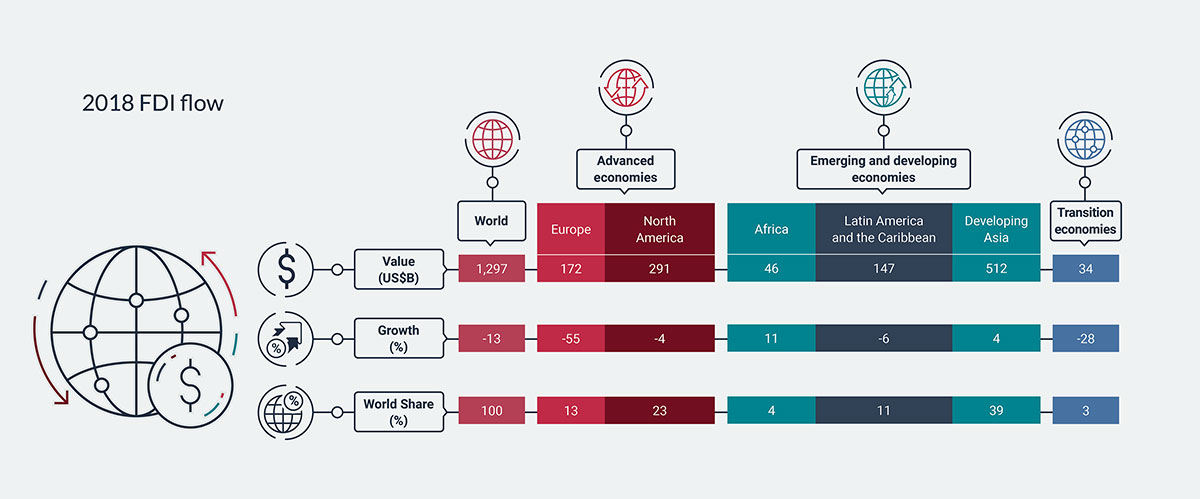
Global foreign direct investment (FDI) inflows decreased for the third consecutive year, from US$1.5 trillion in 2017 to US$1.3 trillion in 2018. As a result, annual global FDI inflows are near their low point, reached after the global financial crisis in 2009.
Developed economies received an estimated US$557 billion in new FDI in 2018, or 43% of global FDI inflows. However, this was down 27%, or US$202 billion, from the previous year. European countries were responsible for almost the entire decrease, falling by an unprecedented 55% to only US$172 billion, mainly due to large repatriations of retained earnings by U.S. multinational enterprises following the Tax Cuts and Jobs Act enacted by the U.S. government in 2017. FDI inflows fell for the second consecutive year in the transition economies (Southeast Europe and the Commonwealth of Independent States), down 28% to about US$34 billion, mainly due to a 49% decline in Russia.
In contrast, inward FDI flows to developing economies remained resilient, advancing 2%, or US$15 billion, to reach an estimated US$706 billion. Combined with the sharp decline in developed economies, the share of developing economies in global FDI flows jumped from 46% in 2017 to 54% in 2018. Developing Asia (+4%) and Africa (+11%) were mainly responsible for this growth, while a decline in Latin America and the Caribbean (-6%) partially offset the gains.
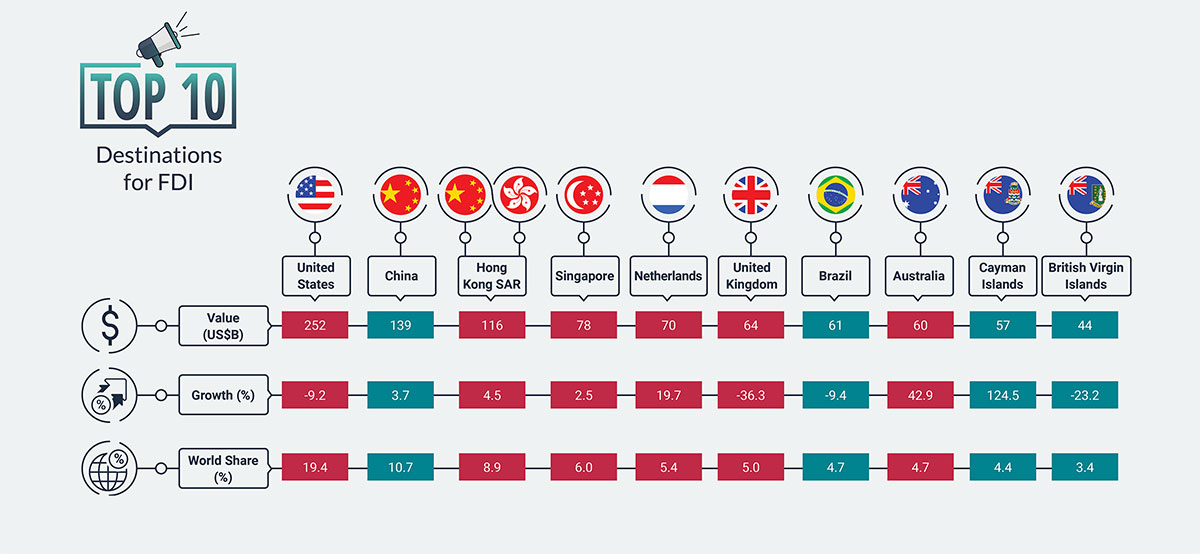
The United States remained the top economic destination for FDI inflows in 2018, in spite of a 9.2% decline. China (+3.7%), Hong Kong SAR (+4.5%), and Singapore (+2.5%) experienced relatively modest increases in 2018. Among the top European economies, the Netherlands registered a 20% increase in FDI inflows, while the United Kingdom saw its FDI inflows decline by 36% in 2018, likely due to uncertainty about the Brexit negotiations.
| 2017 (US$B) |
2018 (US$B) |
Change (%) |
Share 2018 (%) |
|
|---|---|---|---|---|
| World | 1,497 | 1,297 | -13 | 100 |
| Developed economies | 759 | 557 | -27 | 43 |
| Europe | 384 | 172 | -55 | 13 |
| North America | 302 | 291 | -4 | 23 |
| Developing economies | 691 | 706 | 2 | 54 |
| Africa | 41 | 46 | 11 | 4 |
| Latin America and the Caribbean | 155 | 147 | -6 | 11 |
| Developing Asia | 493 | 512 | 4 | 39 |
| Transition economies | 48 | 34 | -28 | 3 |
Source: UNCTAD, World Investment Report, June 2019; retrieved on 21-06-2019
| 2017 (US$B) |
2018 (US$B) |
Change (%) | Share (%) | |
|---|---|---|---|---|
| World | 1,497 | 1,297 | -13.4 | 100.0 |
| United States | 277 | 252 | -9.2 | 19.4 |
| China | 134 | 139 | 3.7 | 10.7 |
| Hong Kong SAR | 111 | 116 | 4.5 | 8.9 |
| Singapore | 76 | 78 | 2.5 | 6.0 |
| Netherlands | 58 | 70 | 19.7 | 5.4 |
| United Kingdom | 101 | 64 | -36.3 | 5.0 |
| Brazil | 68 | 61 | -9.4 | 4.7 |
| Australia | 42 | 60 | 42.9 | 4.7 |
| Cayman Islands | 26 | 57 | 124.5 | 4.4 |
| British Virgin Islands | 58 | 44 | -23.2 | 3.4 |
Source: UNCTAD, World Investment Report, June 2019; retrieved on 21-06-2019