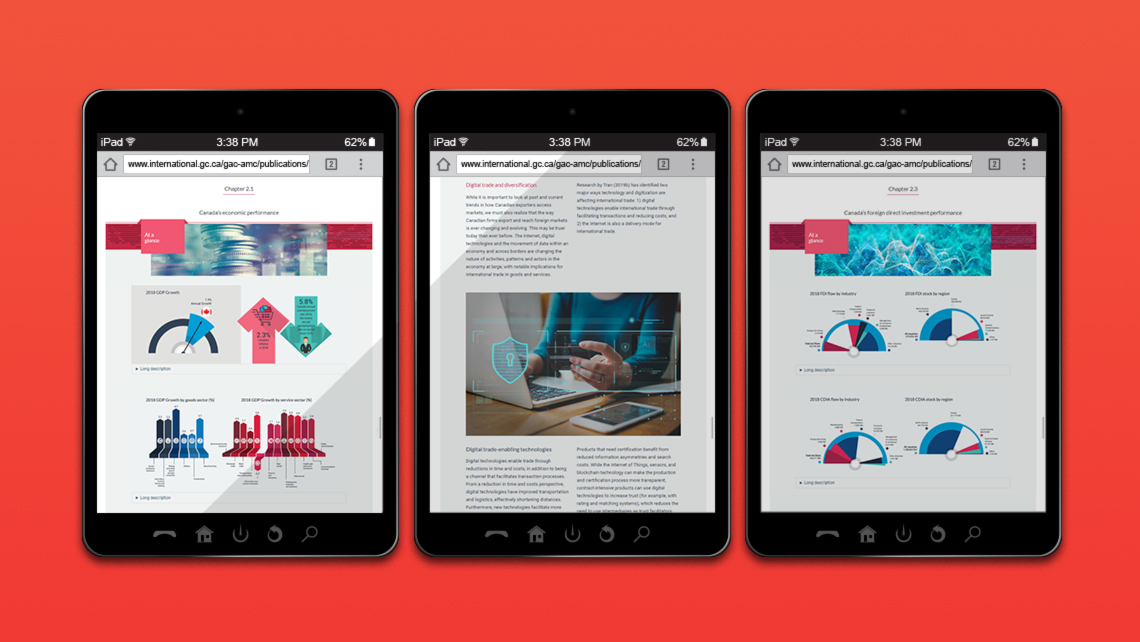
Amaze your audience with our interactive data visualization feature! Bring your annual report to the next level with live and efficient animated charts and statistics, activated by an on-scroll view functionality.
We can create a wide variety of design styles (pie chart, bar graph, column, line, etc.) for all your data visualization needs.

Layout and design of the web page emulating the layout and design of the printed version.
Presentation of many infographics and animated statistics.
100% responsive. The charts automatically adapt to the available space from the device by re-arranging, sizing and toggling their elements and controls.
100% accessible. Custom code truly accessible, compliant with W3C, WCAG 2.0 (Level AA) and compatible with the WET 5.1 and all modern and most legacy browsers (even IE7).

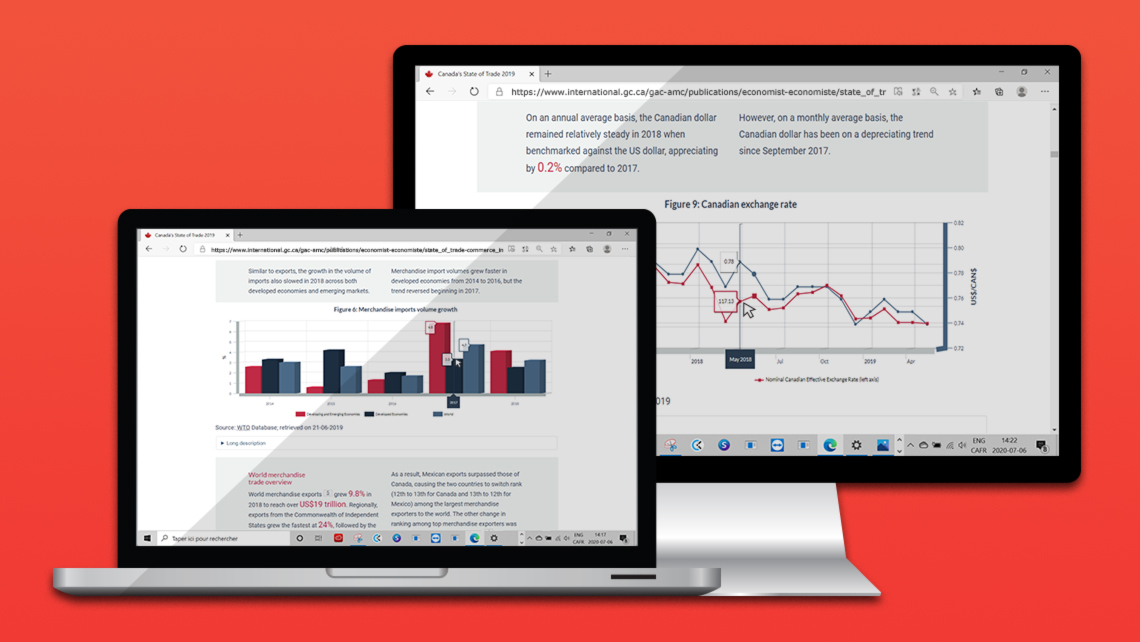

Click on chart elements from the first slide to enable interactivity.
MANDATE SPECIFICATIONS:
TARGETED AUDIENCE:
Global Affairs Canada’ staff (Economic and Trade Analysis Branch, Trade Commissioners, Mission staff abroad) and industry partners.